
How to Make Your Substack Posts Perform Better
Use your stats to boost growth and revenue

Hi Substack creator, hope you’re doing great this week.
This week’s post is about using post performance stats for growth. We’re going to dig into your stats to see how your posts and emails are performing and compare your numbers to industry benchmarks. You’ll learn how to interpret your stats, what ‘good’ looks like and how to make improvements if they’re needed.
This is the final part of my 5-part series Upgrade your publication. If you missed parts 1 to 4, you can check them out below.
Upgrade your publication
Make posts perform better
Post performance means how well your posts are doing at
Helping your readers.
Building the relationship between you and your readers.
Getting new subscribers.
Converting free subscribers into paying subscribers.
Post performance is measured by observing how often your subscribers choose to open your emails, what they do when they open them - for example, do they click any links, or forward your email to anyone? - and how many subscriptions they generate.
How are your posts performing now?
Information about how your posts are performing can be found in two places in your publication dashboard:
[AUDIENCE] > Stats > Posts
[CONTENT] > Posts
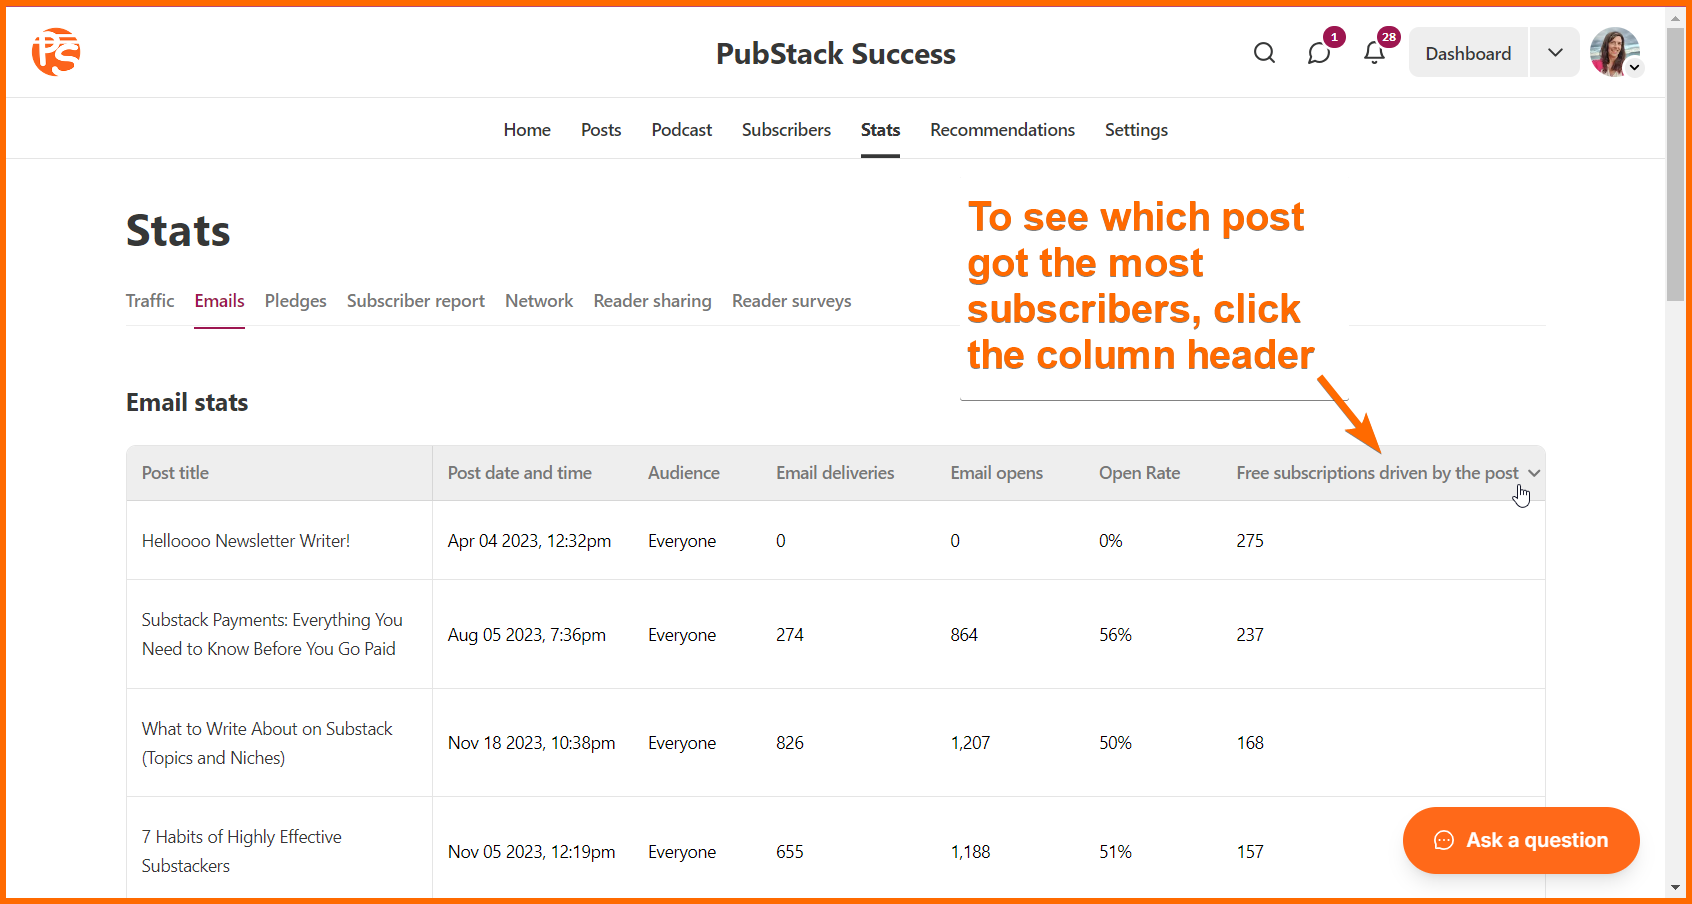
On the [AUDIENCE] > Stats > Posts page, you get information about how each email performed. The information is organised into a table that displays views, engagement, email open rates and subscriptions driven by each post. Scroll right in the table header to see all the stats.
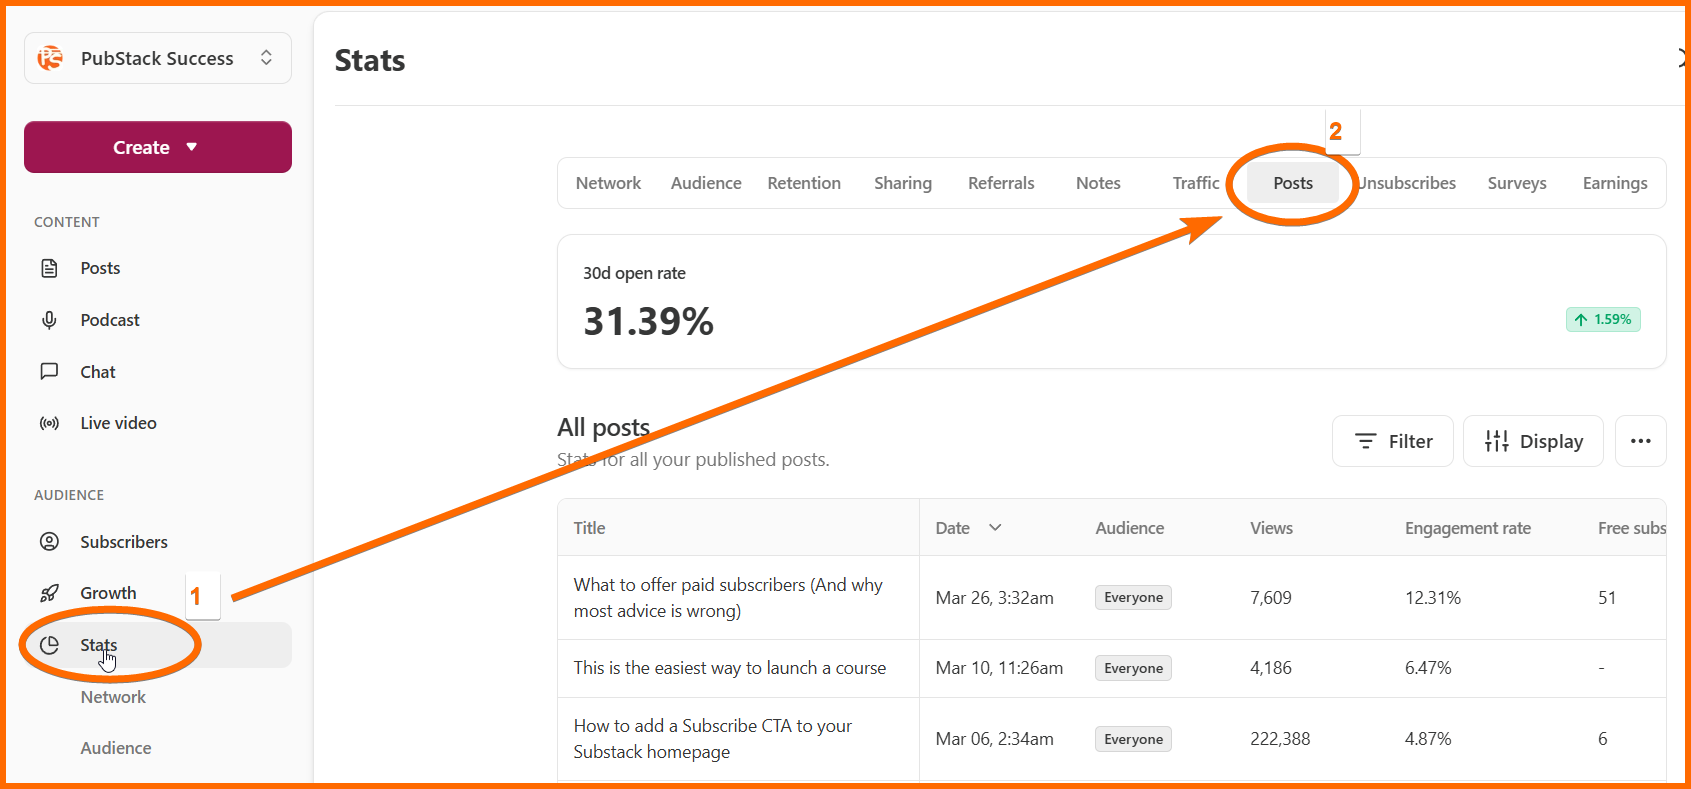
Hot tip: you can sort the table by clicking the column header. For example, if you want to see which post got the most subscribers, click on the column heading ‘Free subscriptions driven by the post’. If you want to see which had the highest open rate, click ‘Open Rate’ in the header row.
In the main [CONTENT] > Posts section of your dashboard you can also see stats for each post, but you can’t easily compare posts with each other.
Check Your Open Rates
What’s a good open rate?
Open rates are an indicator of how excited your readers are to get your emails, and can be a reflection of how engaged your subscribers are, as well as the quality of your headlines.
A low average open rate means your subscribers aren’t excited to hear from you. It’s a sign of trouble for your newsletter. A lower-than-usual open rate for one email could be a reflection on the quality of your headline, or show that your subscribers aren’t interested in the topic in that email, or it could be related to the time or day of the week you sent it.
Open rate indicator:
- Poor: < 20%
- Average: 30% - 50%
- Good: > 50%
In my experience, publications with few subscribers usually have much higher open rates than those with many, and open rates gradually fall as subscriber numbers increase.
That is, if you have 50 subscribers your open rates are likely to be very high, perhaps 80%. But once you reach 6,000 subscribers your open rates may reduce to around 30%, even if your posts are just as good.
Important: Email open rate metrics are not an exact science. Some email inboxes now hide email open counts from senders like Substack, which makes open rate stats inaccurate. This means it’s unhelpful to obsess over the numbers and more important to use them as a comparative tool, and to spot larger trends.
What can we learn from open rates?
For me, the most valuable information I get by reviewing open rates is an understanding of what most excites my readers.
For example, in my paid newsletter, open rates hover at around 30% but when I write about a certain topic, the open rate jumps to around 35%. This shows me that my readers love it when I write about that topic.
Open rates are also a great indicator of the quality of your headlines. Remember, your post headlines become the subject lines of emails. Many email inboxes also show the subheading as a preview. A post with a headline that doesn’t entice your subscribers to click will have a lower open rate than a compelling headline.
How to improve open rates
Open rates can be improved 4 ways:
Sender name optimization
Consistent posting for recognition
Compelling headlines and subheadings
List pruning to remove unengaged subscribers.
Sender names have an impact on open rates. As readers, we are very good at filtering out junk emails, skipping over emails sent by companies.
I strongly recommend you set your sender name to be your name, not a brand name, and consider adding the name of your publication to your sender name so that new subscribers have a better chance of recognizing your emails. If they don’t know who you are they are less likely to open your emails.
Post (email your subscribers) on a consistent schedule so that your readers start to recognize you in their inboxes. When they recognize you they are more likely to open your emails.
Headlines and sub-headings are very important to open rates - it doesn’t matter how good your work is, if people aren’t inspired to open, they will never see it. Use the data in the Stats>Posts part of your dashboard to analyse the headlines of the posts with the best open rates and look for themes or patterns that resonate with your readers.
A final way to improve open rates is to prune your subscriber list by removing people who aren’t opening your emails. This is a risky activity, since open rate measurements are so unreliable.
I don’t recommend list pruning without first inviting readers who appear to be unengaged to click a link to stay on your list. In fact, list pruning is not something I recommend unless you have more than 10K subscribers, or if you need high open rates to entice sponsors or advertisers.
Review Your Subscriptions Generated Stats
Are your posts getting new subscribers?
When I audit Substack publications, a common problem I see is posts that are doing well with current subscribers - for example, open rates are high, or there are likes and comments on the post - but failing to generate new subscriptions.
Usually, this has nothing to do with the quality of the content. Instead, it’s because there are not enough new eyes seeing each post, or because new readers are seeing the posts but aren’t being prompted to subscribe.
To discover whether your posts are working to get new subscribers, check the stats for a few of your recent posts. Here are stats for the latest post in my paid publication:
New subscriptions generated: 2 paid (good!), 0 free (bad!)
Traffic sources: email 99%, other <1% (bad!)
(Hint: Get these stats by clicking on the listing of an individual post in the Posts section of your dashboard: Publication dashboard > [CONTENT] Posts > Name of Post )
These stats tell me I haven’t brought enough new readers to that post - almost everyone who saw it was already a subscriber. However, the post performed okay at converting free subscribers into paid subscribers, so I know the calls to action in the post were effective.
If the stats were different, I would know I had a different problem.
For example, if that post had received lots of views from external sources - say from social media - but had not generated any new free subscriptions I would know the post wasn’t doing a good job of converting readers to subscribers, perhaps because the content wasn’t interesting, or because there were not enough ‘Subscribe’ calls to action in the post.
How to improve your subscriptions-generated stats (and get new subscribers from every post)
It goes without saying that if you want to generate new subscribers from your posts, you need to get new readers. This is where I did badly with my post (Traffic sources: email 99%, other <1%).
But it’s not enough to just get new eyes on your posts. There is a very important next step that many creators miss.
Once you get people to see your post, you need to have elements inside the post that will convert them to subscribers.
To convert casual readers into new subscribers you need two things, in addition to high-quality content:
In-post context,
Compelling calls to action (CTAs).
In-post context means a mini-introduction to your publication inside every post, so new readers understand they are seeing a newsletter, not an ordinary blog or webpage. I’ve written about in-post context before. If you need a reminder, check that it out here:
🍒 In-Post Context: An Overlooked Strategy for Getting More Substack Subscribers 🍒
Compelling CTAs tell readers to subscribe and tell them why - what’s in it for them. The easiest way to add a CTA is to use Substack’s ‘Subscribe with caption’ button. Change the default text of the button and always mention the benefits of your publication.
For example, instead of saying “Subscribe for free to receive new posts”, try “Subscribe to get tasty recipes straight to your inbox each Friday.”
Takeaways
Substack’s stats are a blessing and a curse.
As a rule I’m not much of a stats watcher:
It’s unhelpful to check stats obsessively, as tiny deviations in your numbers can be upsetting and make it hard to stay motivated for the long haul. But….
On the other hand, Substack stats can give you valuable insights. For example, post performance stats can reveal areas that need improvement and show you where you are doing well.
By the way, I have some videos where I screen-share the stats dashboards of my paid and free publications. They are part of my Upgrade Your Substack Program and inside it you get an unobstructed view of my dashboards, website traffic, retention rates, conversion rates, revenue and pricing strategies. It costs $97 and comes with a money-back guarantee.

Okay, that’s it for this week, and for the Upgrade Your Publication Series. I hope you discovered some insights from this post. I’m celebrating finally cracking $20K in my paid publication (August was SLOWWWW). And I expect to have some exciting news to share with you next time I write.
See you then,
Karen
Great tips!
Thanks a ton gor this guide, really means a lot to me!
This guide comes atva time while I am so confused on my entry into substack and if I am doing the right thing by continuing here, and I was also flirting with the idea of just continuing with Medium only..
Thanks a lot!