

Substack stats can be tricky to get your head around at first.
If you’re new to publishing, my best advice is to ignore all stats for the first three months. Why? Because you won’t have enough data to reliably learn anything, and you’ll be wasting time that could be spent meeting new readers and writers and practising the harder-than-it-looks skill of pressing ‘Publish’ every single week.
On the other hand, if you’ve been publishing on Substack for a while and have at least 5 posts, 20 notes and 10 subscribers, then read on.
In this post:
Where to find stats in Substack
Stats are everywhere in Substack. Here are the main places you’ll find them:
Main page of publication dashboard
Posts section of dashboard
Main metrics for recent posts
Drill down for: Individual post views, open rates, engagement rates, traffic sources
Growth section of dashboard
Traffic sources for visitors, free subscribers, paid subscribers
Drill down for: Individual notes conversions
Stats section of dashboard
Network effect - the number of subscribers gained from the Substack network
Audience location and overlap with other publications
Retention and churn figures (paid publications only)
Sharing counts - which subscribers are sharing your publication
Referral counts - figures for gifts (paid publications only)
Total traffic - view counts for a specified period, filterable by source
Posts - detailed figures for each post in a sortable, customisable table, including free and paid conversions and revenue
Unsubscribe counts and reasons (paid publications only)
Surveys - number of responses, results of surveys
Earnings - lifetime earnings (paid publications only)
Recommendations section of dashboard
Counts of subscriptions received from and sent to other publications through Substack recommendations
Notes list (in personal profile/activity)
Count of impressions and interactions for individual notes
How to access and understand stats
Dashboard Stats
The main page of your publication dashboard displays a high-level view of the health of your publication, including subscriber numbers, growth and revenue.
What to look for: Don’t sweat the details here. If the line on your dashboard is going upwards and to the right, you’re doing great. Flatter areas of the chart represent slower growth. Where the line curves upwards more steeply, that represents faster growth.
Hint: You’ll get better information from charts on Substack if you choose a longer time frame from the drop-down list. On the main dashboard page you’re looking for big trends; it’s not a place to sweat the small plateaus.
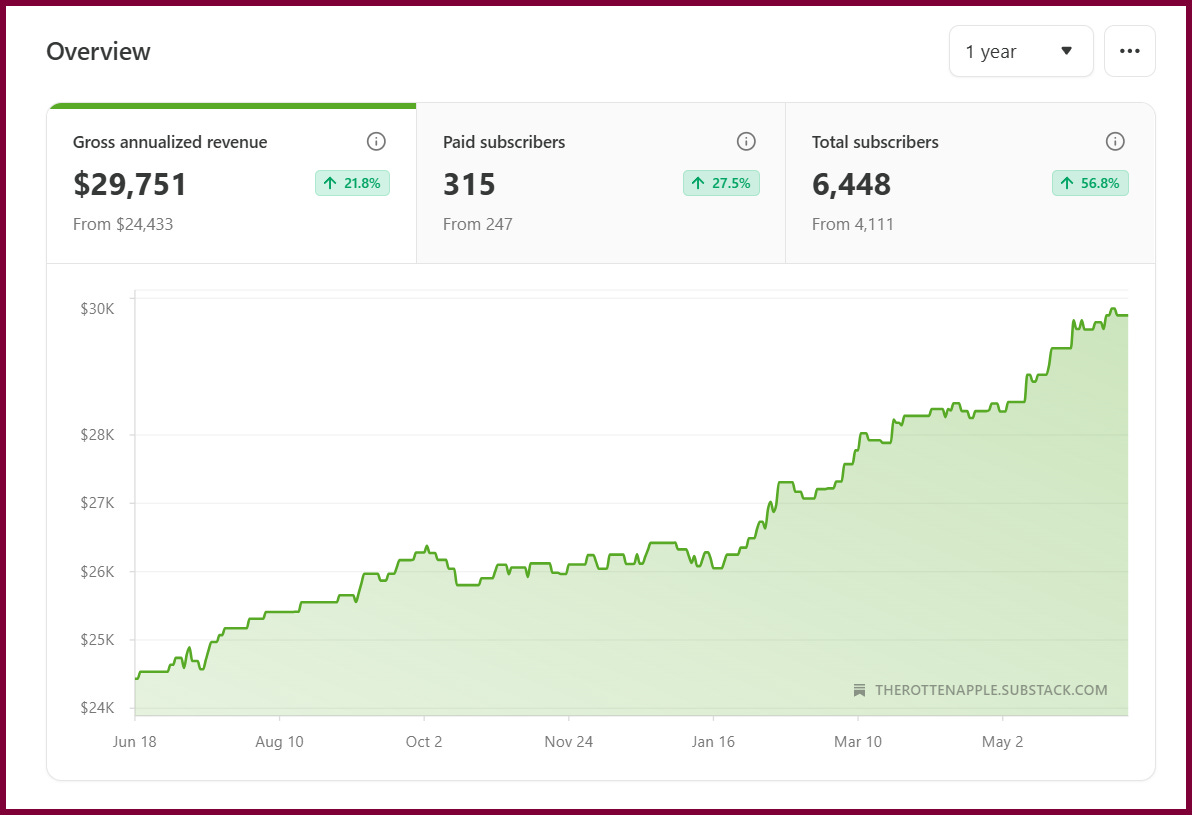
Good to know: You can disable the chart view by activating the ‘Hide stats’ toggle in the ‘Privacy’ section of your Publication’s settings.
Post Stats
Posts section
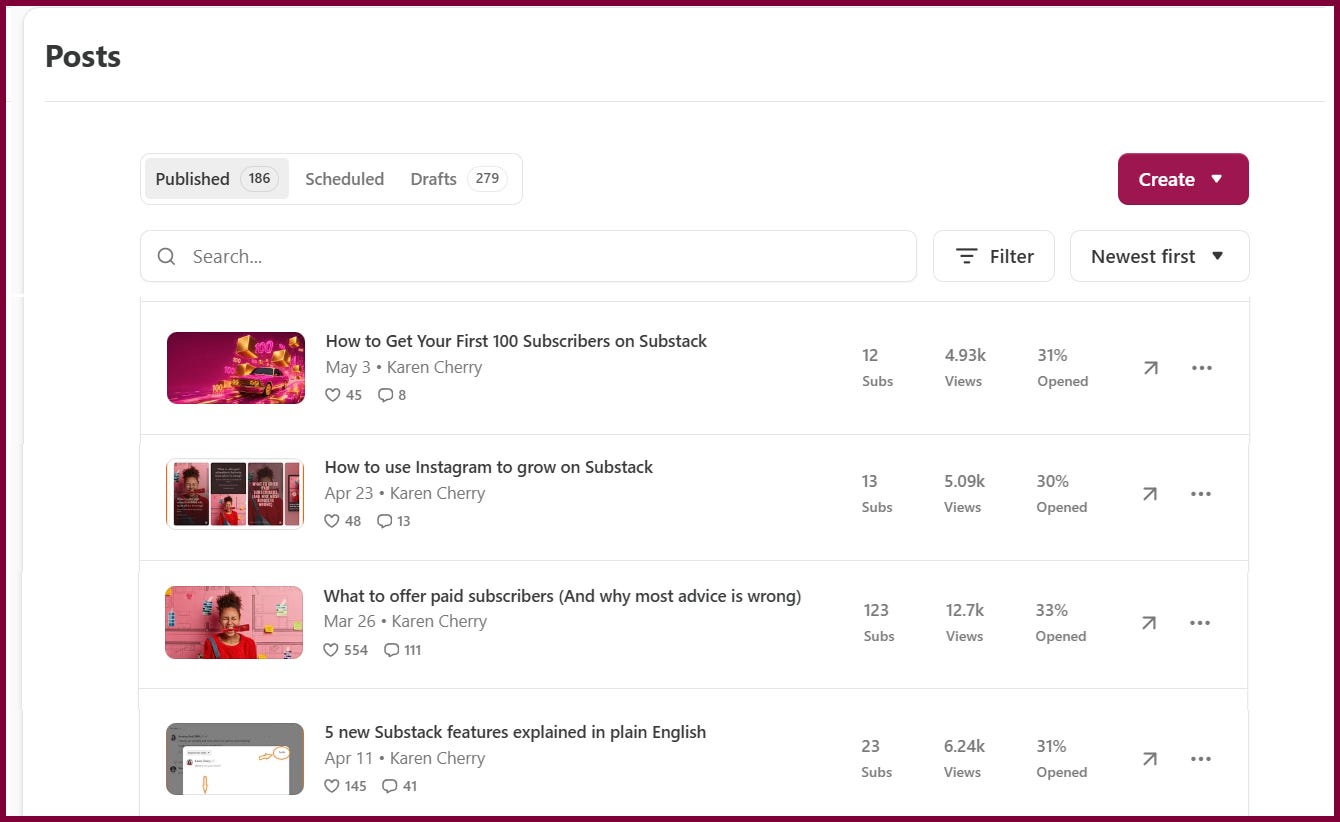
The posts section of your publication dashboard gives an overview of stats from your most recent posts, including how many people opened the post, how many people viewed the post and how many new subscribers were generated.
What to look for: Open rates above 20% and at least one new subscriber per post.
Individual post stats
Click on an individual post in the list of posts to see more stats, including the number of email recipients, the sources of views and link click statistics.
For example the post in the screenshot below had 8,630 recipients (receipients = the number of subscribers who were sent an email or push notification for the post), 5,088 views (total views are the total number of times the post has been viewed across the web, app, email and Substack app) and an open rate of 29.59% (the percentage of people who viewed this post after receiving it in their email inbox or Substack app).
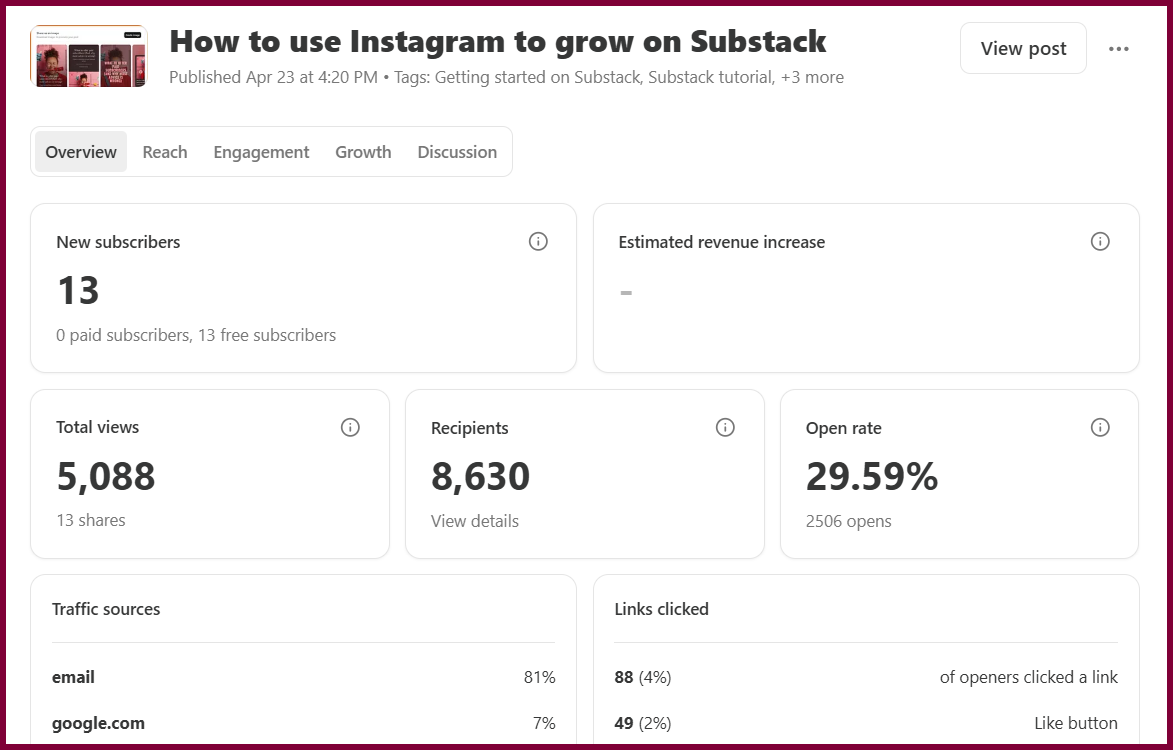
What to look for: Low open rates can indicate that your post title wasn’t compelling enough. Posts that don’t generate new subscribers indicate that you weren’t getting it in front of new readers, or you weren’t giving new readers a compelling reason to become subscribers.
Table of posts stats
There’s a better way to see post stats than clicking into each post individually. You’ll find a table of post stats if you navigate to the ‘Stats’ section of your dashboard and select ‘Posts’ from the tabs across the top of the page.
The magic of viewing your post stats in this table is that you can sort your posts by key metrics like subscriptions generated to get a big-picture view of the types of posts that are helping you grow.
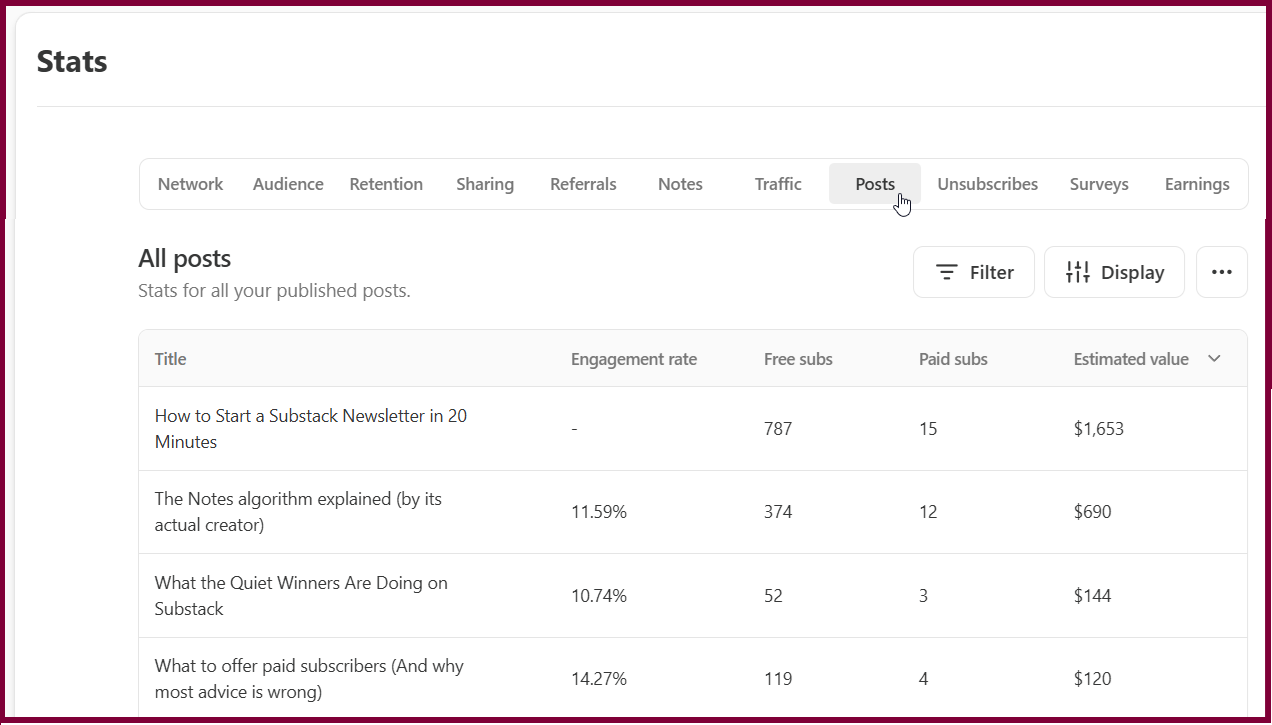
How to use it: To sort the list of posts, click the column label to sort from highest to lowest. The filter function allows you to see the stats for just one subset of your posts, such as those with a specific tag. The display function lets you choose which metrics to display in the table.
What to look for: Look for topics and titles that resonated, posts that gained new subscribers and posts that converted free to paid (‘estimated value’). Click open the posts with the best numbers to see whether they contain a call to action (CTA) that is particularly effective.
Traffic and Growth Stats
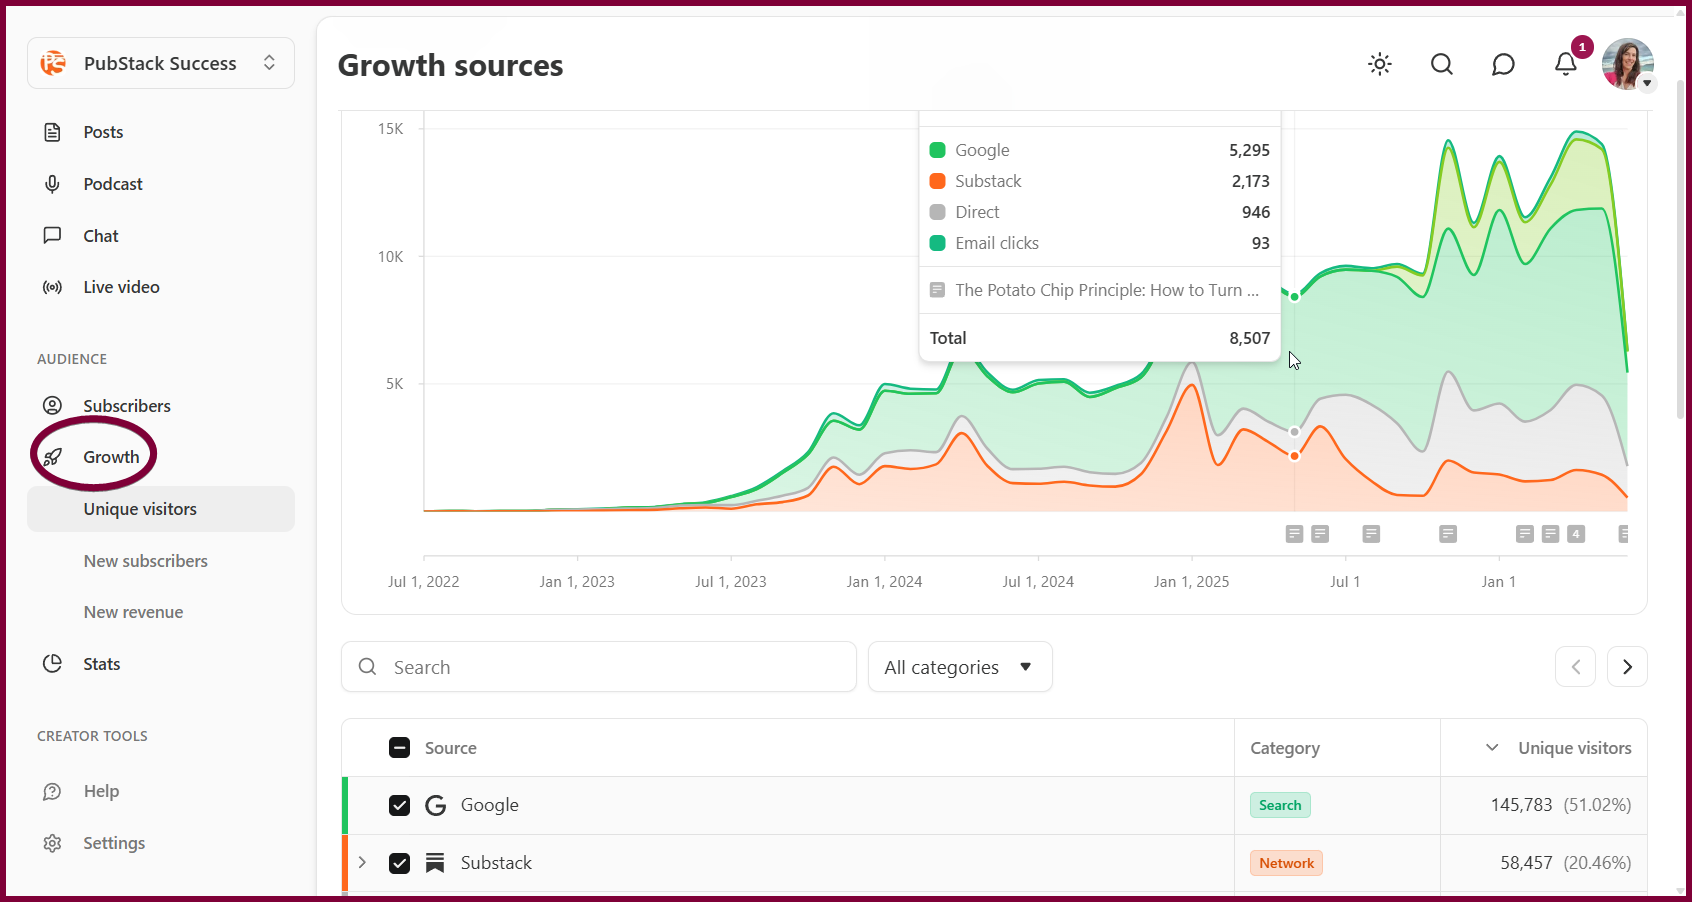
The ‘Growth’ part of the ‘Audience’ section of your dashboard contains stats about where your viewers and subscribers are coming from and shows which traffic sources generated the most visitors, free subscribers and paid subscribers.
What to look for: Use the ‘Growth’ page to discover your best traffic sources, so you can double down on the sources that are working. For example, if you get a lot of paying subscribers from Google, you might decide to increase the number of search-optimised posts each month.
Hint: This is also where you can see which notes performed best (select ‘new subscribers’, click the dropdown arrow next to Substack to find ‘Notes’, then click down again to see individual notes)
For total traffic counts, navigate to ‘Stats’ section, then choose ‘Traffic’ from the tabs across the top of the page. (Total traffic = the number of times your publication was viewed during a specific period, including emails).
Other Stats
Extra stats for paid publications
Paid publications also have access to figures for:
retention (the proportion of your paid subscribers who stay subscribed),
unsubscribe reasons and
lifetime earnings.
Find these in the ‘Stats’ section of your publication dashboard in the tabs marked ‘Retention’, Unsubscribes’ and ‘Earnings’.
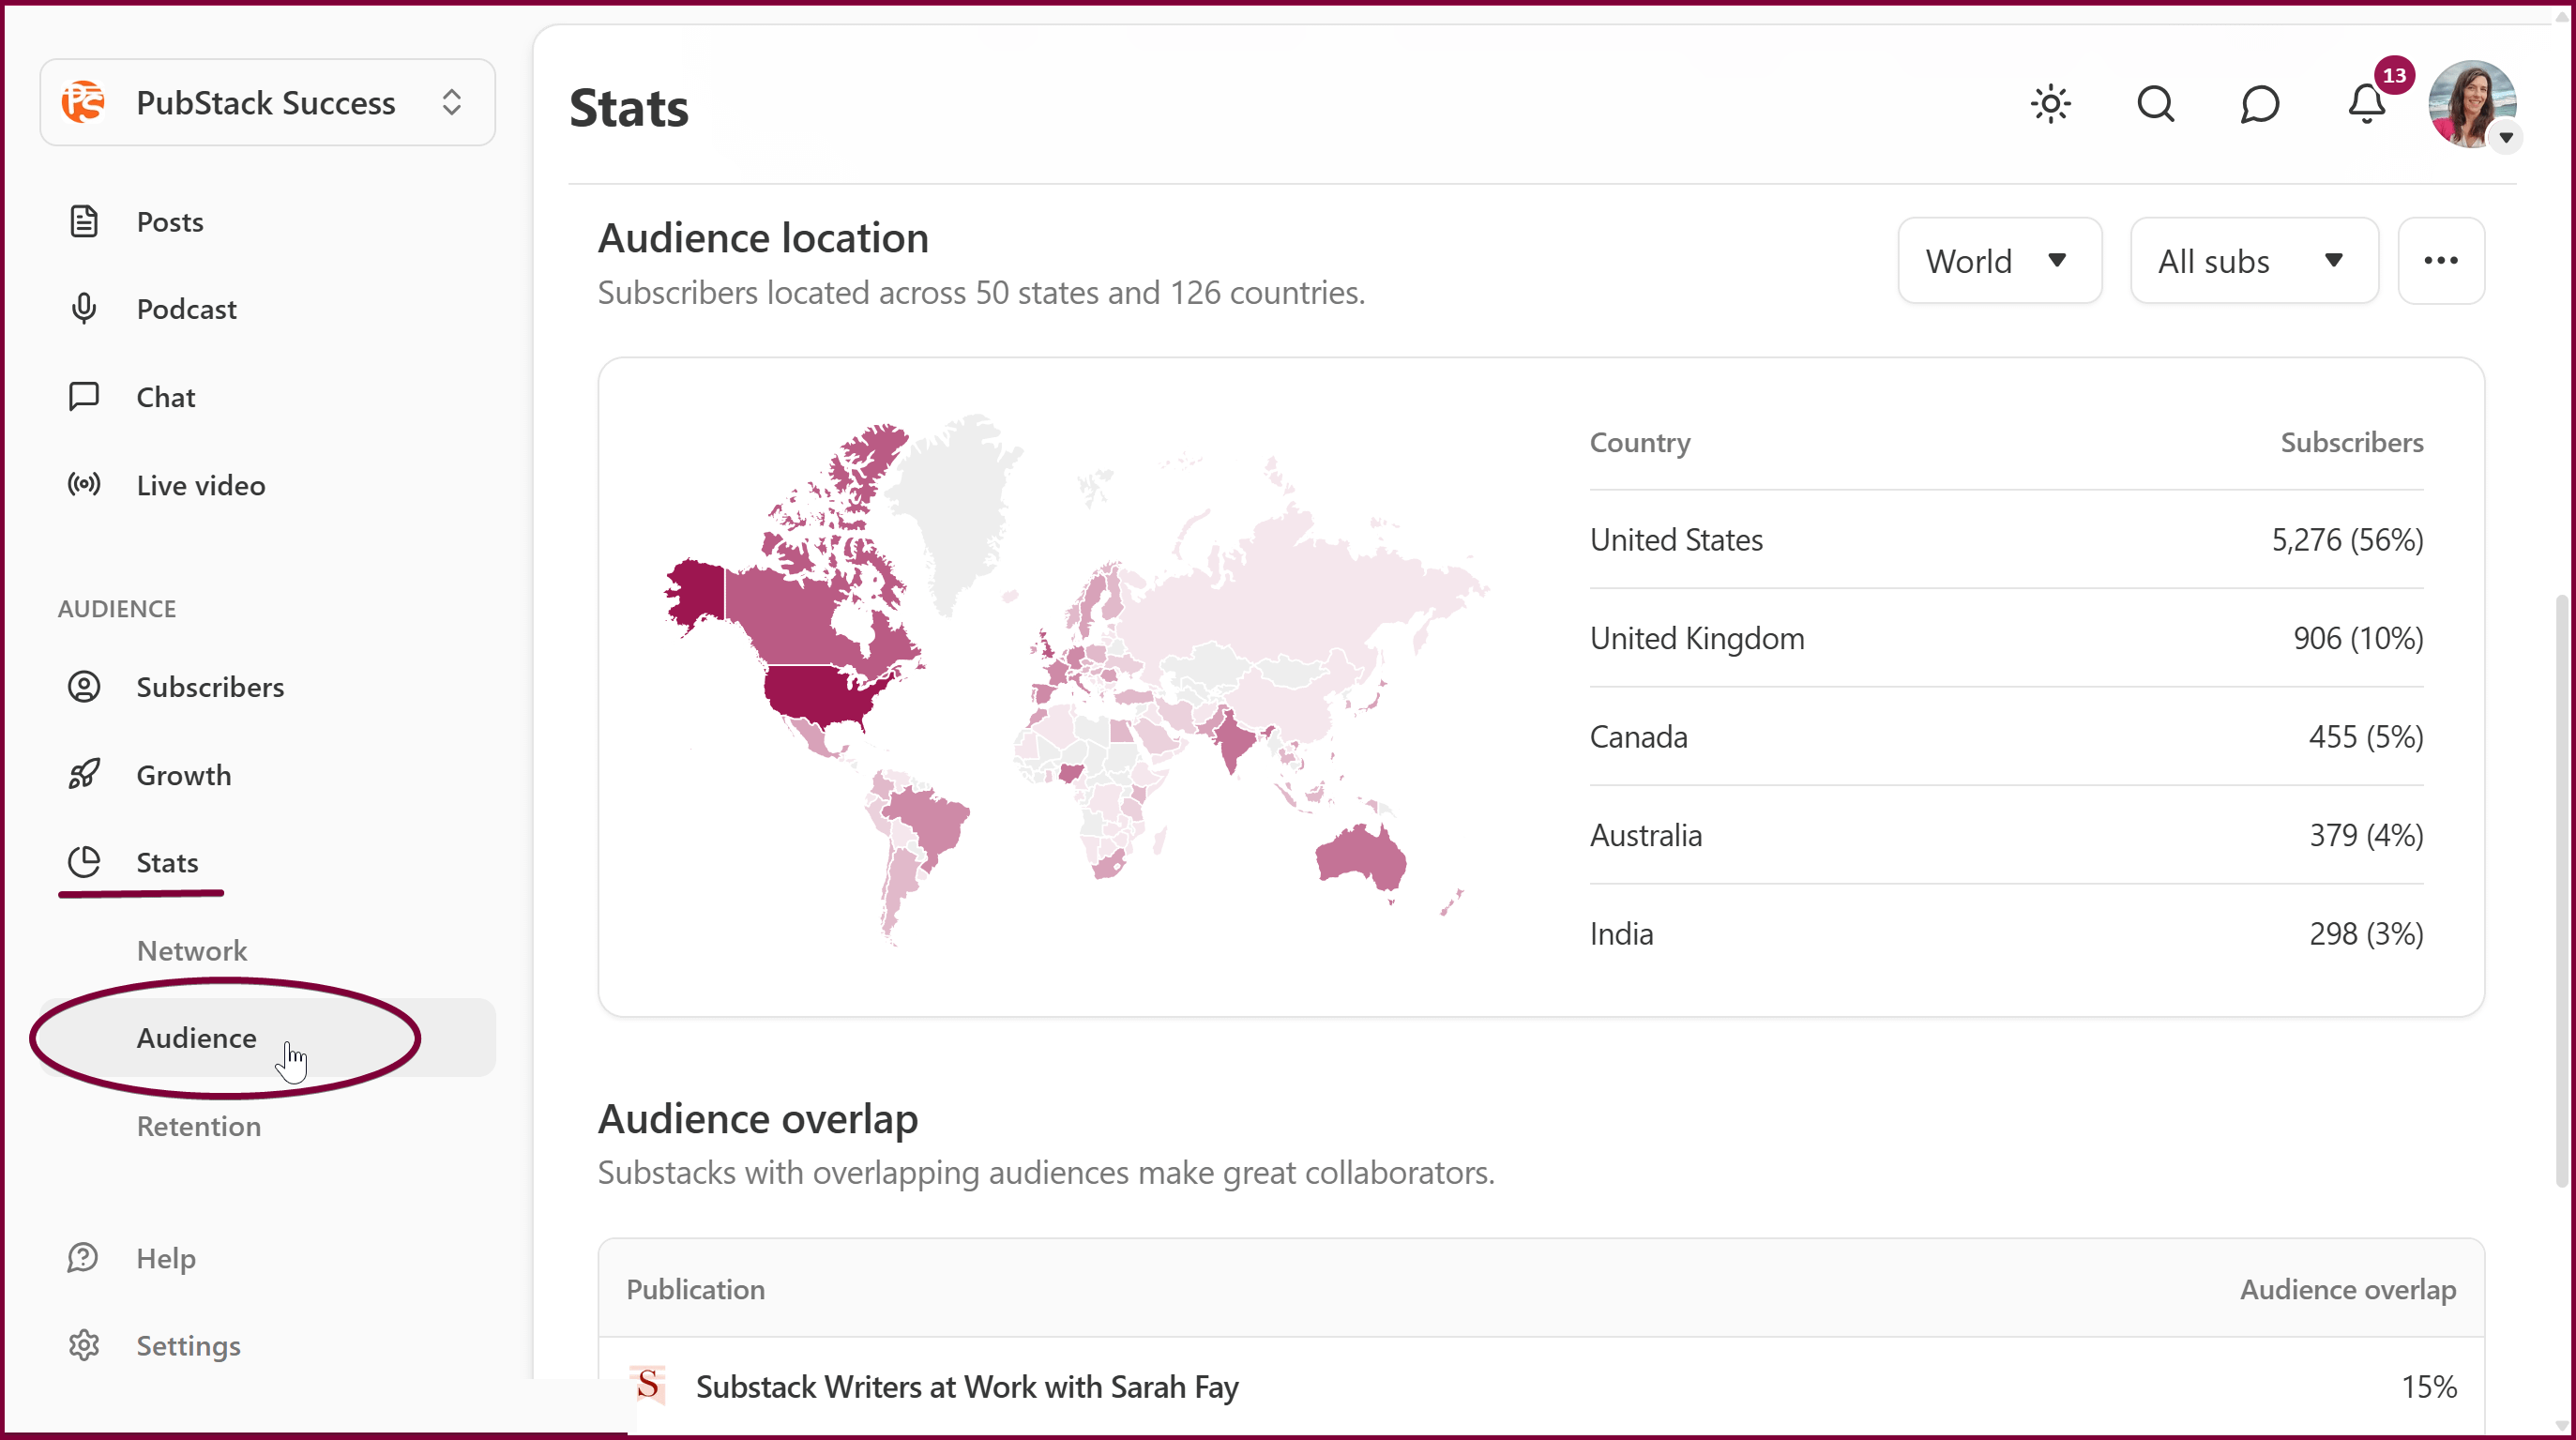
Audience location and overlap
Use the data in the ‘Audience’ tab of the Stats section of the dashboard to discover where your subscribers live and find publications whose readers overlap with yours.
Recommendation Stats
In the ‘Recommendations’ part of ‘Creator Tools’, you’ll find stats for how many subscribers you’ve received from recommendations and how many recommendations you’ve generated for others.
Hint: ‘Creator Tools’ is on the left menu of the publication dashboard: you may need to scroll down to find it.
Notes Stats
It’s possible to access stats for individual notes, such as the number of impressions and interactions they received. To do this, first find your list of notes in your personal profile (open your personal profile, then find the ‘Activity’ tab underneath your bio), then click on the three-dot menu in the top right corner of the note to access its stats.
However, a better way to check Notes stats is to compare a larger set of your notes to see which brought you the most subscribers. Do this from the ‘Growth’ part of the ‘Audience’ section of your dashboard: select ‘new subscribers’, find Substack in ‘sources’, click the dropdown arrow next to Substack to find ‘Notes’, then click the next arrow to see a list of individual notes. Full instructions here: How to Check Your Notes Performance
How to Check Your Notes Performance

How to see which notes brought you the most subscribers and which ones bombed, plus one quick win.
Which stats actually matter?
There are so many different stats available to you in the Substack dashboard, and even more if you connect an external tool like Google Analytics.
You could spend hours every week obsessing over stats if you wanted to. Don’t. There are a few numbers that are worth paying attention to and many that are not. Too much time in the stats will rob you of precious hours you could be writing high-quality posts for your readers.
In this section, I’ll tell you about the metrics that matter, and how to use them to help grow your publication, plus the ones you can safely ignore.
Advice from the trenches
I think it’s actually a mistake to pay too much attention to reader numbers. I did that for a long time, but now I’m less invested in the numbers. As long as there is an upward trend over time, and I’m doing the best I can to turn out consistent work, I’m holding fast to the idea that I’m on the right track. Elizabeth Beggins of Chicken Scratch
Metrics that matter
A metric is a quantifiable value that businesses use to monitor and measure success. In Substack, metrics include your subscriber statistics, website visitor numbers (‘traffic’), and revenue, if you have enabled paid subscriptions.
Why look at numbers?
It’s often said that what you pay attention to is where you will see results. Or, as Tony Robbins says, “Where focus goes, energy flows”.
Where focus goes, energy flows
Tony Robbins
Subscriber count
If you want to make an impact with Substack, you’ll want your publication to grow. That means more subscribers. If you want more subscribers, follow Tony Robbins’ advice and pay attention to your subscriber count.
Best practice: Take a look at the subscriber chart on your publication homepage once a month. You’re looking for a slope that goes upwards to the right. It’s best to take a long-term view by choosing ‘One year’ or ‘All time’ from the dropdown list.
Open rate
The second metric that matters if you want to grow is your open rate. If people are not consistently opening your emails or clicking on your posts in the app inbox, you’ll struggle to build a relationship with them: they’ll be less likely to spread the word about your publication, less likely to purchase from you and more likely to unsubscribe.
Therefore, open rates are important for growth and impact.
(BTW open rates are also important if you plan to seek sponsorship, run advertisements or sell your publication.)
Hint: Larger lists typically have lower open rates, so don’t be alarmed if the 80% average open rate you had when your list was tiny shrinks to 30% when your list is bigger.
Best practice: It’s best to compare open rates between your own posts, looking for trends, patterns and blips rather than comparing your stats with other publications. If growth is your goal, the actual numbers are less important than the trend or pattern they reveal.
Top tip: Don’t underestimate the importance of post titles. Even the most brilliant posts will have low open rates if they don’t have compelling titles.
Growth sources
Another important thing to know is where you are getting new subscribers from. That means paying attention to how people find your posts (‘unique visitors’) and which traffic sources bring you the most subscribers (‘new subscribers’), remembering they may be different. Access these stats from the ‘Growth’ part of the ‘Audience’ section of the publication dashboard.
Post conversions
Finally, if you offer paid subscriptions and want more revenue, it is important to pay attention to which posts have done best at encouraging free subscribers to upgrade to paid. There are two ways to do this.
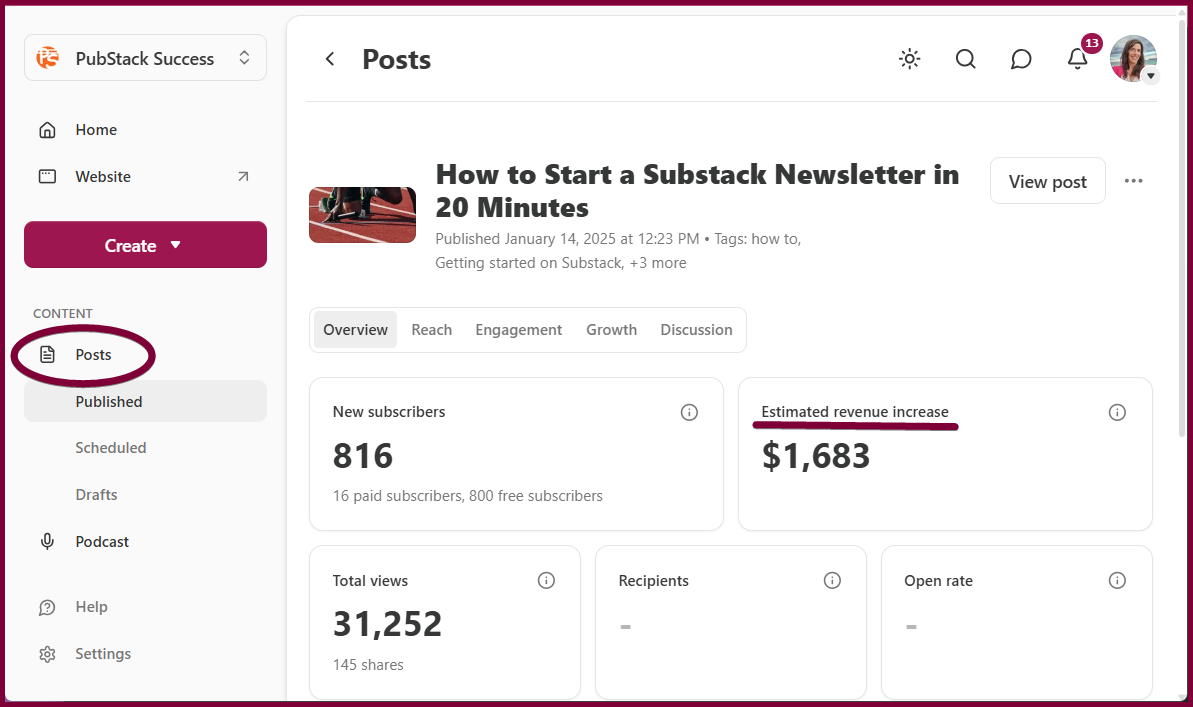
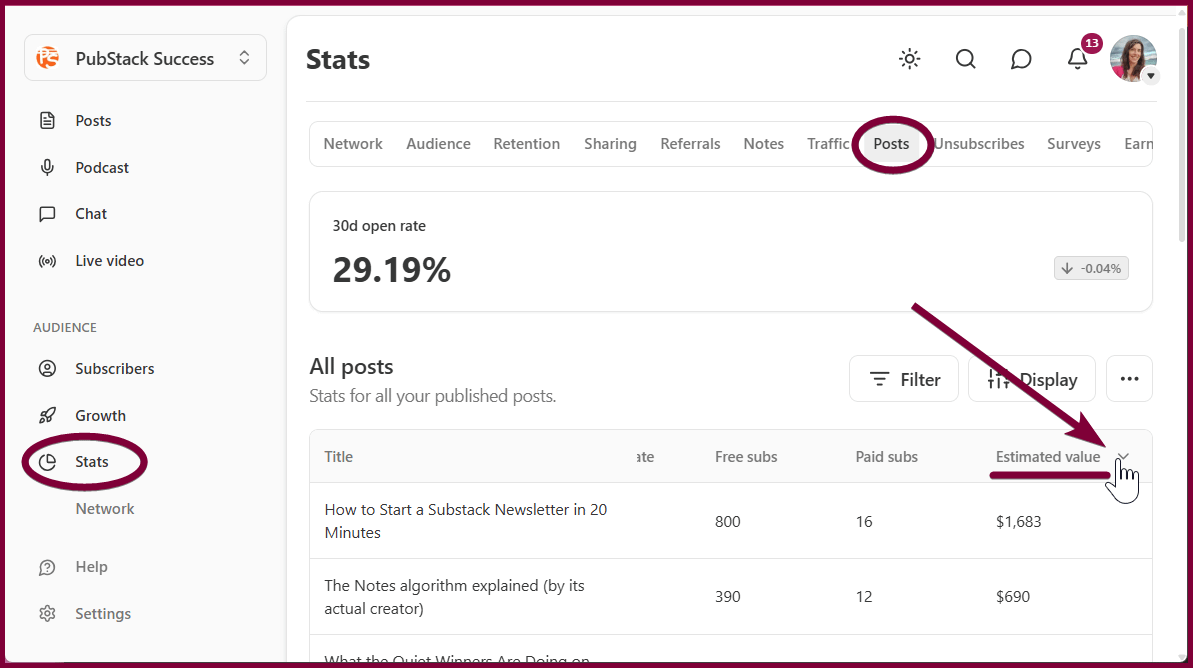
To check revenue generated by individual posts, use either (1) individual post listings (click on a post in the ‘Posts’ list in the ‘Content’ section of your publication dashboard to see ‘Estimated revenue increase’), or (2) check the ‘All posts’ table in the ‘Stats’ part of the ‘Audience’ section of your dashboard.
Hint: To sort the table of posts, scroll right in the scroll bar at the bottom of the table until you find the column of data you want, then click the column header to sort the list in ascending or descending order.
To recap, when it comes to growing a Substack publication, these are the numbers that are the most important:
Subscriber counts
Open rates
Traffic sources
Post conversions (posts that convert free subscribers to paid)
Stats to check occasionally
Recommendations: Find out who’s recommending your publication so you can return the favor.
Unsubscribe feedback: Paid publications get access to feedback from readers who don’t renew their paid subscriptions. If your publication is paid, check unsubscribe feedback occasionally – say once per quarter - to get information about why paid subscribers are leaving.
Access unsubscribe feedback from the ‘Unsubscribes’ tab of ‘Stats’ (only available to paid publications)
Audience location and audience overlap: Check these to see which countries your subscribers live in and to see which other publications your audience reads to get ideas for collaborations.
Access these from the ‘Audience’ tab of ‘Stats’.
Notes conversions: If you use Substack Notes regularly, it’s worth checking which of your notes generated new subscribers (hint: it’s often NOT the notes that got the most likes or replies). Do this in the ‘Growth’ stats, as described earlier.
Stats that matter less than you think
Likes and comments on posts
I was stalking a successful newsletter the other day, and noticed that there were 64 responses to a poll. It was a compelling article, and it was aimed at Substack writers – exactly the sort of people who would be inclined to engage with a poll. I’m telling you this because at the time the publication had 14,000 subscribers.
Say what?! A successful newsletter, with tens of thousands of subscribers, managed to collect just 64 poll responses? Wow. That’s less than half of one percent of subscribers.
The same post had 16 comments and 73 likes, equally low response rates for a publication with more than ten thousand subscribers.
I’m telling you this because creators often get discouraged by low numbers of likes and comments. Don’t be discouraged. If you have 100 subscribers and you get 1 like you are actually getting much better engagement than many popular, long-running newsletters like the one I just described.
Some newsletters get very high levels of likes and comments; some do not. These levels are not linked to ‘success’.
A few years ago, my food safety newsletter was generating tens of thousands of dollars of revenue per year while getting almost no likes or comments. On the other hand, Pubstack Success was flooded with comments and likes from a much smaller audience. Both newsletters are a success, even though the audience engagement rates are very different.
Remember: Likes and engagement can provide you with feedback about what your audience enjoys, but they aren’t reliable indicators of success or failure.
Follower numbers
Follower numbers also mean very little in Substack and aren’t worth paying attention to…. the magic of Substack is the relationship you can have with subscribers, not followers.
Daily view counts and subscriber counts
Watching subscriber numbers and views tick up or down day‑by‑day encourages emotional decision‑making and can undermine your progress. A monthly or quarterly overview is far more useful than frequent checking of the subscriber numbers or views.
Notes impressions and engagement
It can be fun to see a note go viral (i.e. get a high number of impressions), but virality rarely translates to stable growth or high-quality subscribers. Likewise, high engagement on a note doesn’t reliably correlate with new subscribers or paid conversions. Instead, pay attention to which types of notes successfully generated new subscribers, as described above.
Final thoughts
Obsessively checking stats is a fool’s game - don’t be sucked in.
You have no direct control over your stats.
All you can do is write well, give people a reason to open your posts, tell people to subscribe and strive to be shareable. If you do this, your stats will go in the right direction all by themselves.
And you’ll be able to enjoy the process much more easily!
Okay, that’s it from me for this week. Have a good one!
Karen
P.S. If you’d like me to take a look at your stats, be sure to book a one-hour video call with me. I’ll listen to your goals, review your current situation and help you chart a path forward. If I can’t help you improve your publication with sensible, actionable advice that’s tailored to your personal style and your audience, you get your money back.
Whoa! This is a thorough walkthrough. I enjoyed reading it and will be back from time to read and reread thank you dear.